Next Gen Stats: Introduction to pressure probability
Football has often been described as a game won in the trenches. For years, however, quantifying the performance of individual blockers and pass rushers remained a challenge. Traditional statistics might tell us how many times a quarterback was sacked or hit, but they fall short in capturing the nuance of individual performance in these matchups. To bridge this gap, Next Gen Stats presents pressure probability, a groundbreaking approach developed in partnership with Amazon Web Services, utilizing real-time player tracking data and state-of-the-art AI.
Next Gen Stats and AWS team up to quantify pressure
Since first partnering in 2017, the NFL’s Next Gen Stats group and Amazon Web Services have been aiming to push the boundaries in football analytics. What started with new stats like completion probability and expected rushing yards evolved into a library of advanced stats that span defensive coverages, fourth-down decisions and even the return game. The 2023 offseason was no different.
Inspired by several submissions from the 2023 Big Data Bowl, the group developed a series of machine-learning models that (1) identifies blockers and pass rushers on every pass play, (2) quantifies the evolving dynamics of pressure and (3) detects all individual blocker-rusher matchups.
- Blocker and rusher identification: Using a graphic neural network model (GNN), we can accurately discern which players are blocking (versus running a route) and which defenders are pursuing the quarterback (versus dropping into coverage) in real time.
- Pressure probability: This model gauges, in tenths of a second, the likelihood of each defender creating a pressure (the definition of which you can find below). The output of the random forest model offers a multitude of measures to assess each pass rusher’s performance on every play. In addition to a team composite pressure probability model, two separate models were created to quantify pressure for each individual pass rusher.
- Blocking matchups: The final model identifies “who blocked who” on a given pass play. The model tracks matchups, helping us attribute pressures and sacks to individual blockers, and even spotlight blocking strategies like double teams and chip blocks.
And the best part? Each model is fully automated and integrated within the Next Gen Stats data pipeline, with historical data available for every pass play since 2018.
The anatomy of pressure probability
An individual pass rush is temporal by nature. The opportunity of a defender to generate pressure directly depends on how long the quarterback holds onto the ball. Whether the quarterback is making a quick pass or undertaking an extended dropback, the raw production of a pass rusher is not a complete measure of performance.
Our previous logic to identify pressures with tracking data was relegated to a defender’s proximity to the quarterback. (Any pass attempt or sack where a defender was within 2 yards of the QB at pass forward or within 1.5 yards of the QB at any point during the play counted as a pressure.) But this ignored how a quarterback reacts to the oncoming rush, whether there were any blockers in the pass rusher’s path, and how pressure evolves over the course of a dropback. Pressure probability unlocks these missing insights.
In total, over 13 different metrics can be derived from an individual pass rusher’s pressure probability estimates. It’s no longer just about binary results:

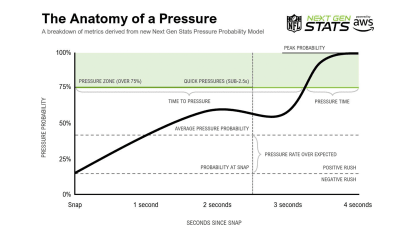
- Pressure is defined as a pass-rush play where the rusher affects the quarterback before the pass is thrown. A pass rush becomes a pressure when pressure probability exceeds 75 percent. This includes sacks, QB hits, QB hurries and other plays where the pass rusher comes into close proximity with the quarterback; it will also include plays where the pass rusher has a free path to the QB or is winning the matchup with the blocker.
- Pressure rate is the total number of pressures divided by the total number of pass-rush snaps. The average pass rusher generates pressure on 10.3 percent of pass-rush plays.
- Time to pressure is the time elapsed from snap to the first moment of pressure. The average pressure occurs in 2.9 seconds.
- Quick pressures are defined as a pressure that occurs within the first 2.5 seconds of a play.
- Pressure time is the total duration a pass rusher spends with a pressure probability over the 75 percent threshold.
- Pressure probability at snap is a player’s estimated probability of generating a pressure on the play based on the alignment and relative locations of each pass rusher and blocker on a pass play.
- Average pressure probability is a pass rusher’s average pressure probability over the course of a pass dropback.
- Pressure rate over expected is the difference between average pressure probability and probability at snap on a single pass-rush play or across a series of pass rushes.
- Peak pressure probability is the maximum pressure probability value reached by a pass rusher over the course of a play.
- Positive rushes are pass-rush snaps when a player’s average pressure probability exceeds their probability at snap.
- Negative rushes are pass-rush snaps when a player’s average pressure probability is less than their probability at snap.
- Positive rush rate is the percentage of positive pass-rush plays. The average pass rusher has a positive rush rate of 54 percent.
- Net positive rushes is the net difference between the number of positive pass rushes and negative rushes.
Pressure in action
Consider Micah Parsons‘ sack in the Week 2 matchup between the Jets and Cowboys. Late in the game, with the Cowboys leading 30-10, Parsons sacked Zach Wilson for a 5-yard loss:
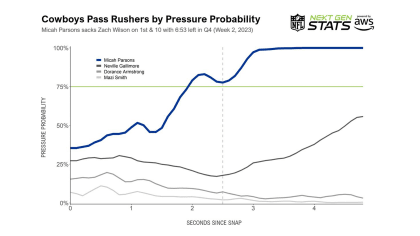
It took Parsons only 0.33 seconds to cross the line of scrimmage after the snap. That is one of the fastest pass-rush get-off times on a play this season (and the sixth-quickest on a sack since start of 2022). Parsons’ anticipation of the snap — combined with an advantageous alignment from a wide-nine technique off the right edge against Duane Brown — equated to a pressure probability at snap of 35.4 percent (a mark that ranks in the first percentile on all pass-rush snaps). A breakdown of each of the Cowboys’ pass rushers shows how quickly Parsons created a pressure on the play.

Parsons beat his block to set up an unimpeded path to Wilson in two seconds flat (in other words, this counts as a quick pressure), with an average pressure probability of 74.8 percent over the 4.8-second dropback (39.4 percentage points over expected). Parsons’ peak pressure probability converged to 100 percent within three seconds, with a full 2.9 seconds spent pressuring Wilson over the course of the play.
Through the first two games of the 2023 season, Parsons is tied with the Titans’ Arden Key for most pressures league-wide (15 each), and ranks first in quick pressures (8), pressure time (17.2 seconds), positive rushes (42), net positive rushes (+29) and average pressure probability (28.3%, among 292 pass rushers with at least 10 pass-rush snaps).
Quantifying performance of offensive linemen
After successfully identifying blockers and pass rushers (model 1) and effectively quantifying the temporal nature of pressure (model 2), we now turn our attention to the prevention of pressure — individual pass-blocking matchups. Our third model in the series is a machine learning model to determine who blocked who on a given play.
We can now identify matchups, attribute sacks to individual blockers, discern double teams and much more. Key metrics include:
- Matchup frequency is the total number of plays where an individual blocker is matched up against an individual blocker.
- Pressures allowed is a count of the total number of pressures allowed by an individual offensive lineman against a matched-up pass rusher.
- Sacks allowed can also be attributed to an individual blocker.
- Pressure rate allowed is the total number of pressures allowed divided by the total number of pass blocking snaps by an individual offensive lineman.
- Double teams are now identified when two or more blockers engage with a single pass rusher over the course of a dropback.
It has been very difficult to quantify the performance of offensive linemen in the past. Now, we can access rich, temporal data about pressures allowed, at every timestamp, on every pass play, leading up to the time the quarterback gets rid of the ball or takes a sack.
Redefining football analytics
In the NFL, the quest for excellence is unrelenting. Every athlete, coach, and team is perpetually pursuing a competitive edge. Increasingly, technological advances in fields like machine learning and data analysis are becoming the game-changers that elevate performance.
The partnership between the NFL’s Next Gen Stats and Amazon Web Services is at the epicenter of this shift, continuously redefining the limits of football analysis.
This collaboration has allowed us to stop focusing on binary pressure outcomes, instead offering a comprehensive evaluation of pass-rush and blocking performances, providing new insights that were previously inaccessible. Pressure probability empowers fans, analysts, coaches and players with a deeper appreciation for the intricacies of the game and adds a new layer of excitement to every play. As technology continues to advance, we can only anticipate even more exciting developments in football analytics.


